Getting Started with Dashboards
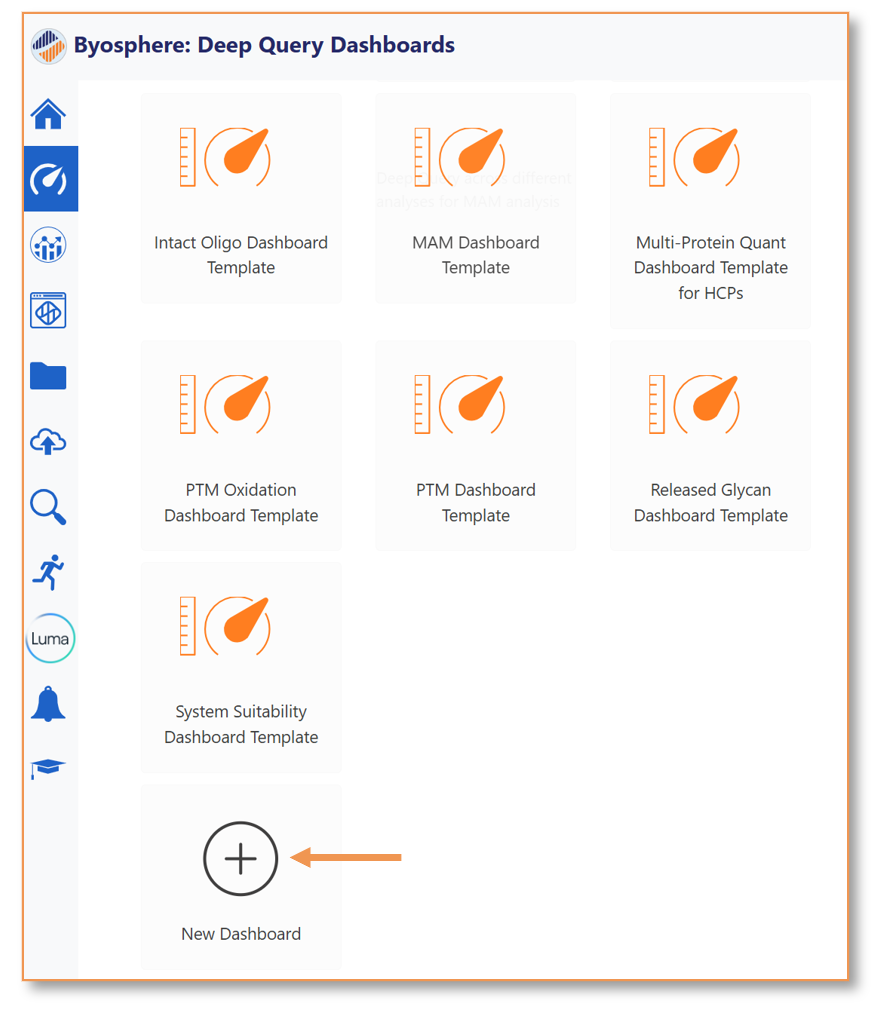
To help you get started with Dashboards, a wide range of templates and example dashboards are provided and can be found on the Deep Query Dashboards page, in the System Dashboards section:
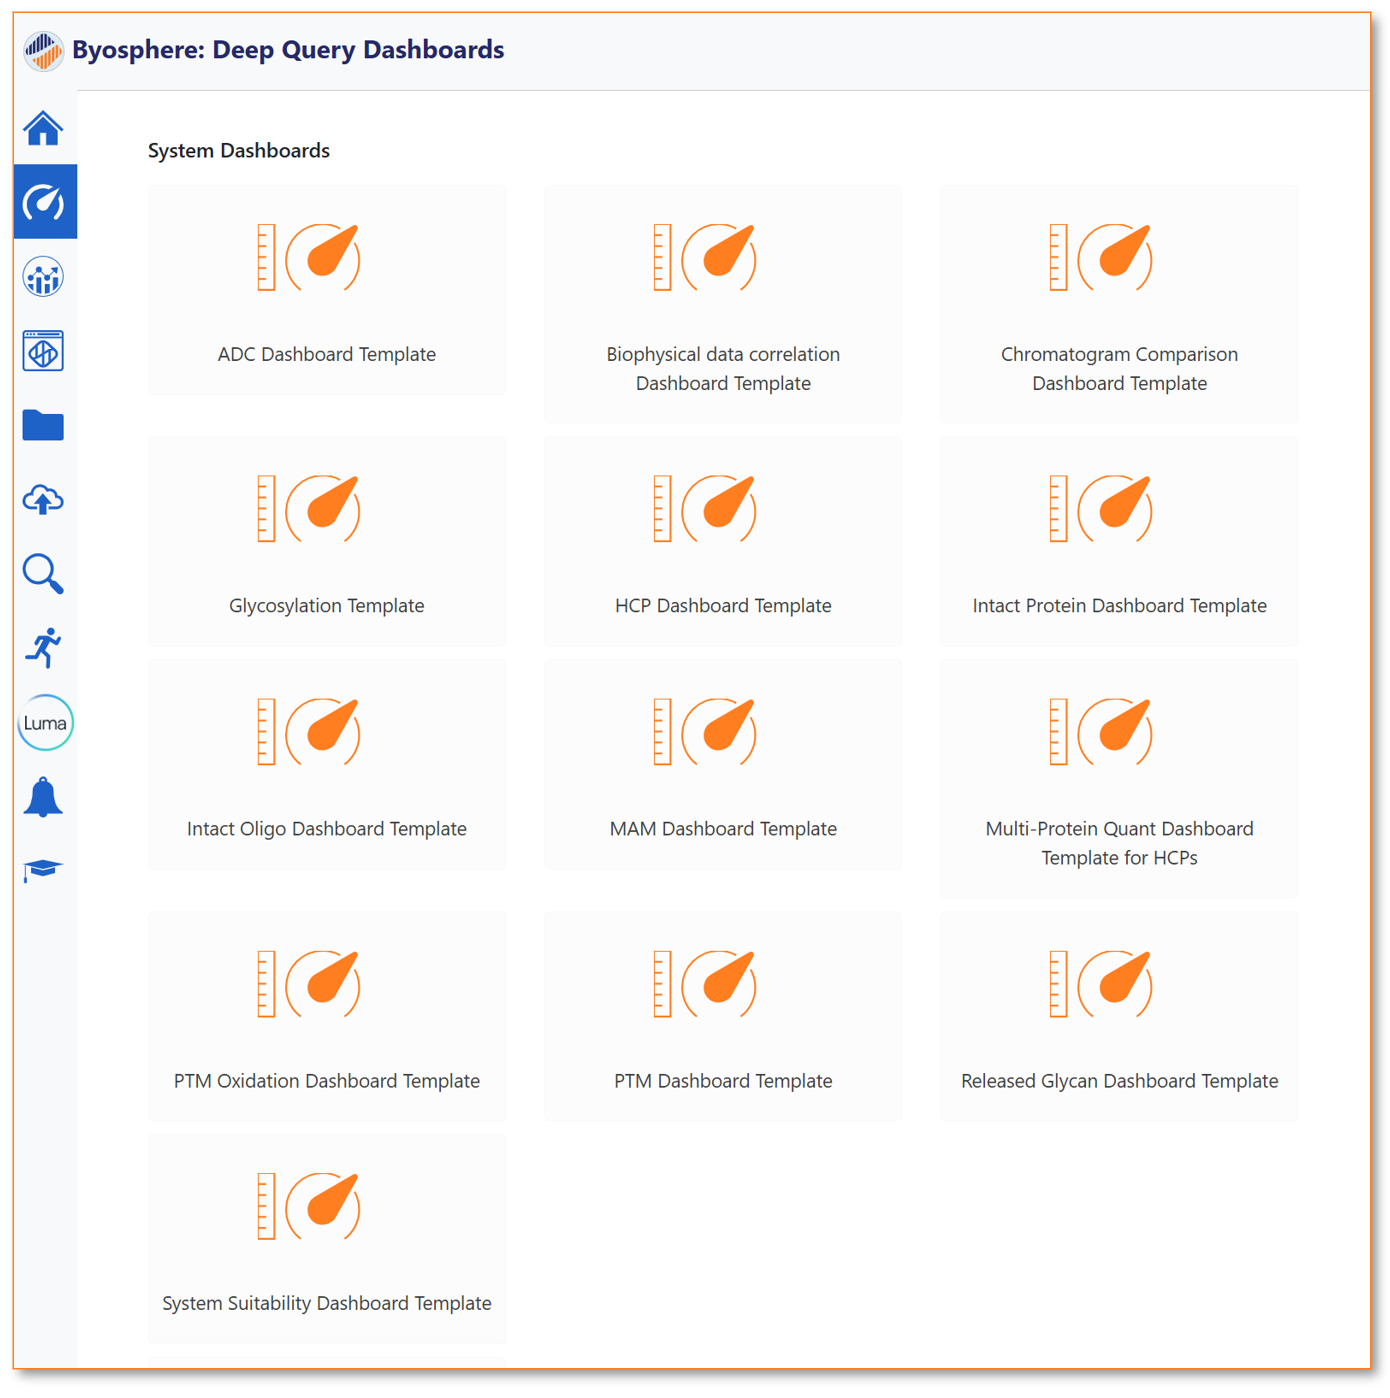
Creating a New Dashboard Using a System Dashboard Template
-
Select a Template: Choose a template based on the desired analysis type.
-
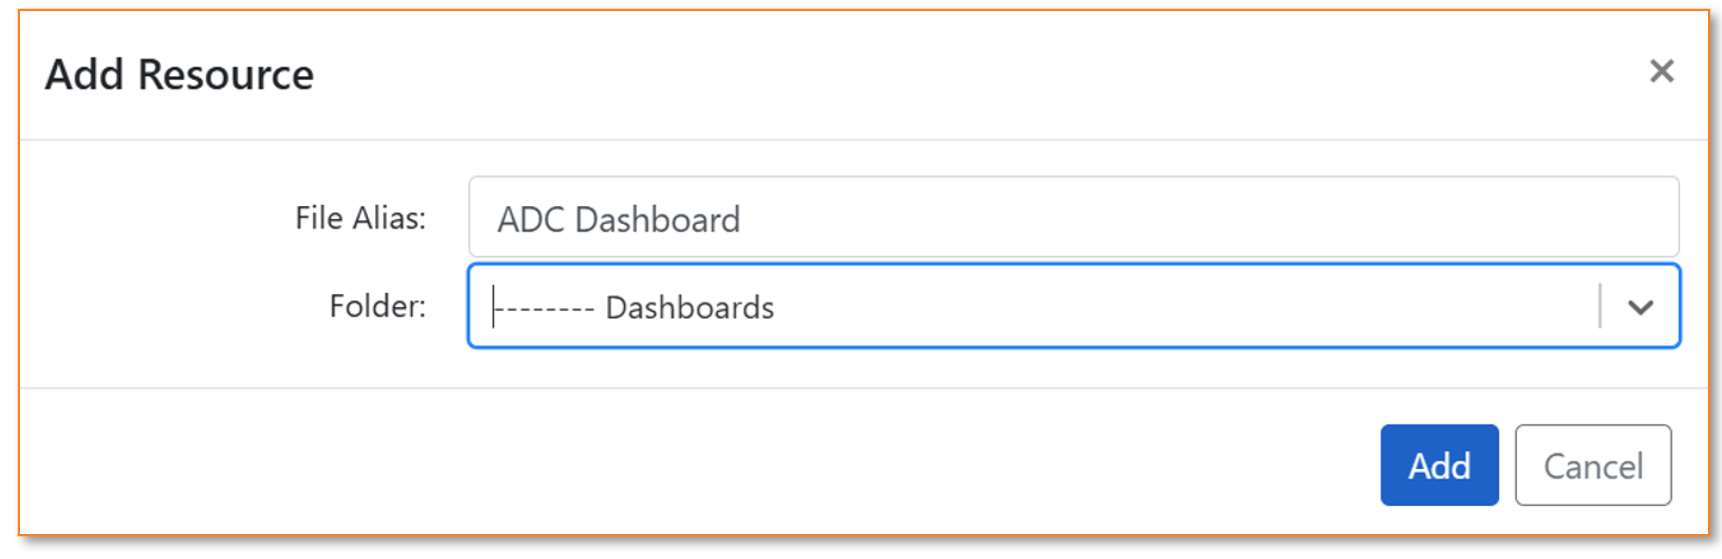
Provide a File Alias: Name the dashboard for easy identification.
-
Choose a Folder: Specify where the dashboard will be saved.
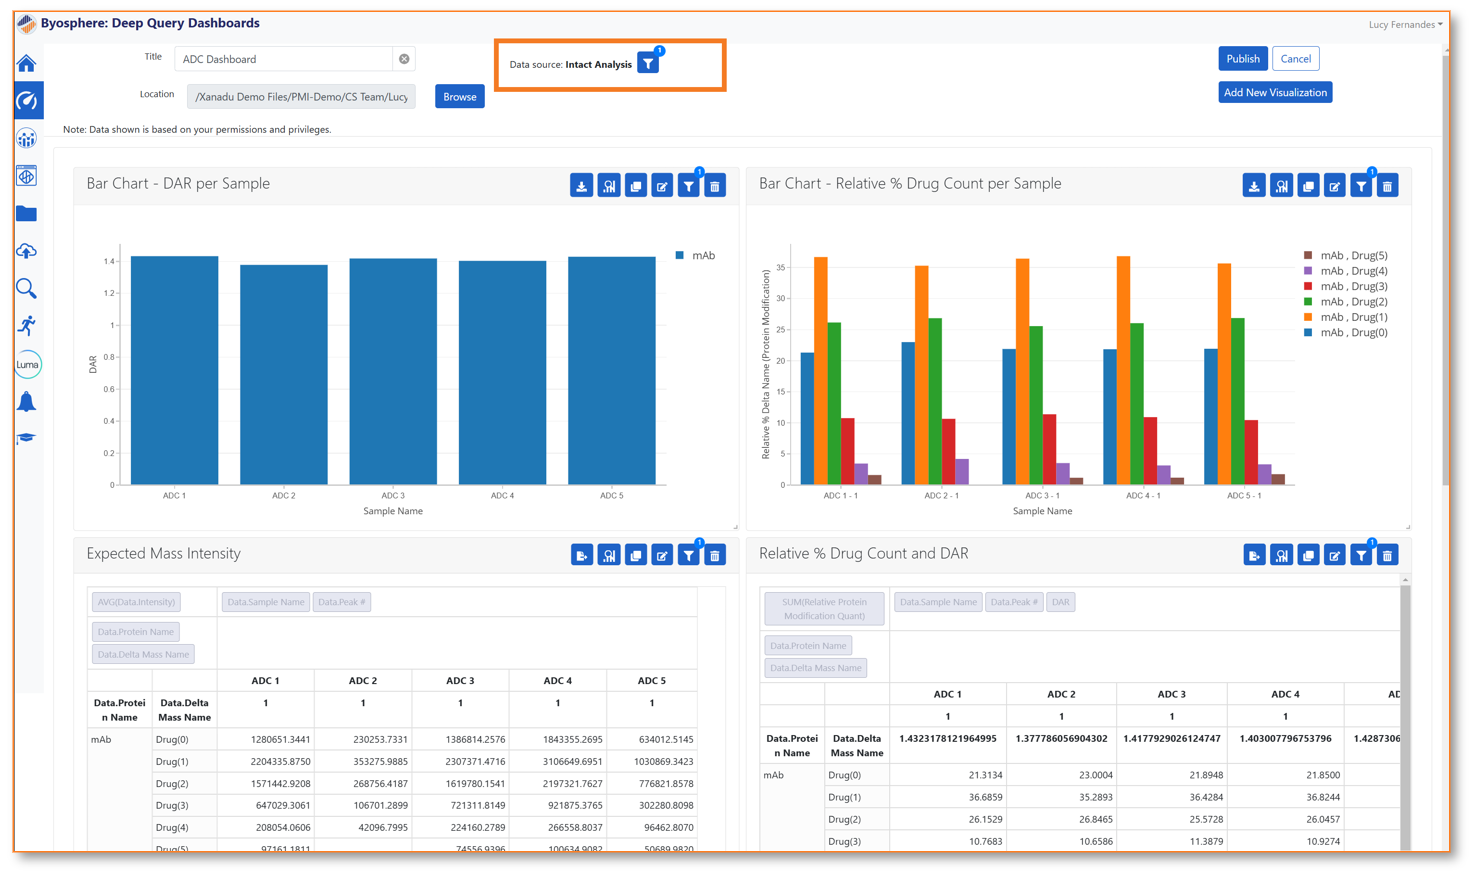
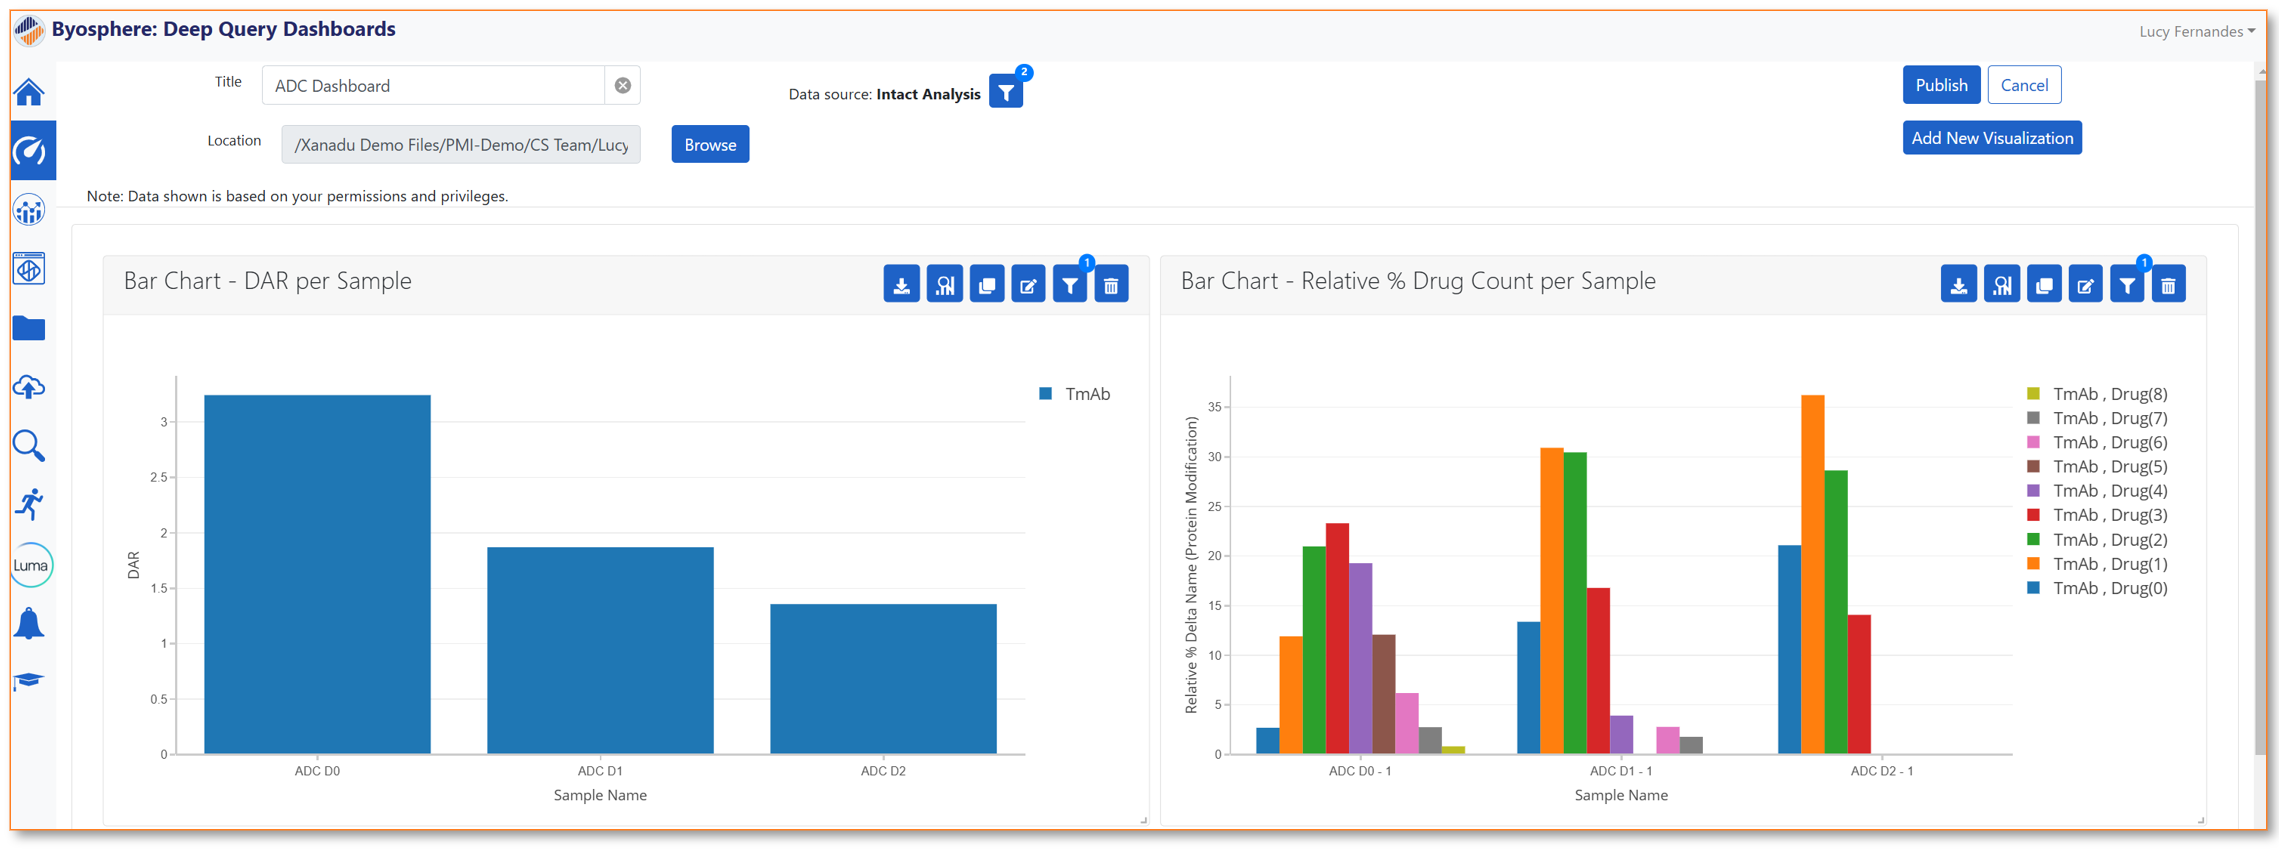
The system dashboard templates are configured to query data from pre-loaded demo projects. For example, when a dashboard is created using the ADC Dashboard Template the data displayed in the visualizations is coming from a pre-loaded project named ADC System Template. This selection is set-up in the global filter option (at the top) and can be changed to ingest/query any project that is present on the Byosphere system.
Configuring Dashboards to Query Different Projects
1. Adjust Global Filters:
- Open the global filter settings at the top of the dashboard.
- Configure filters using Metadata (or data fields).

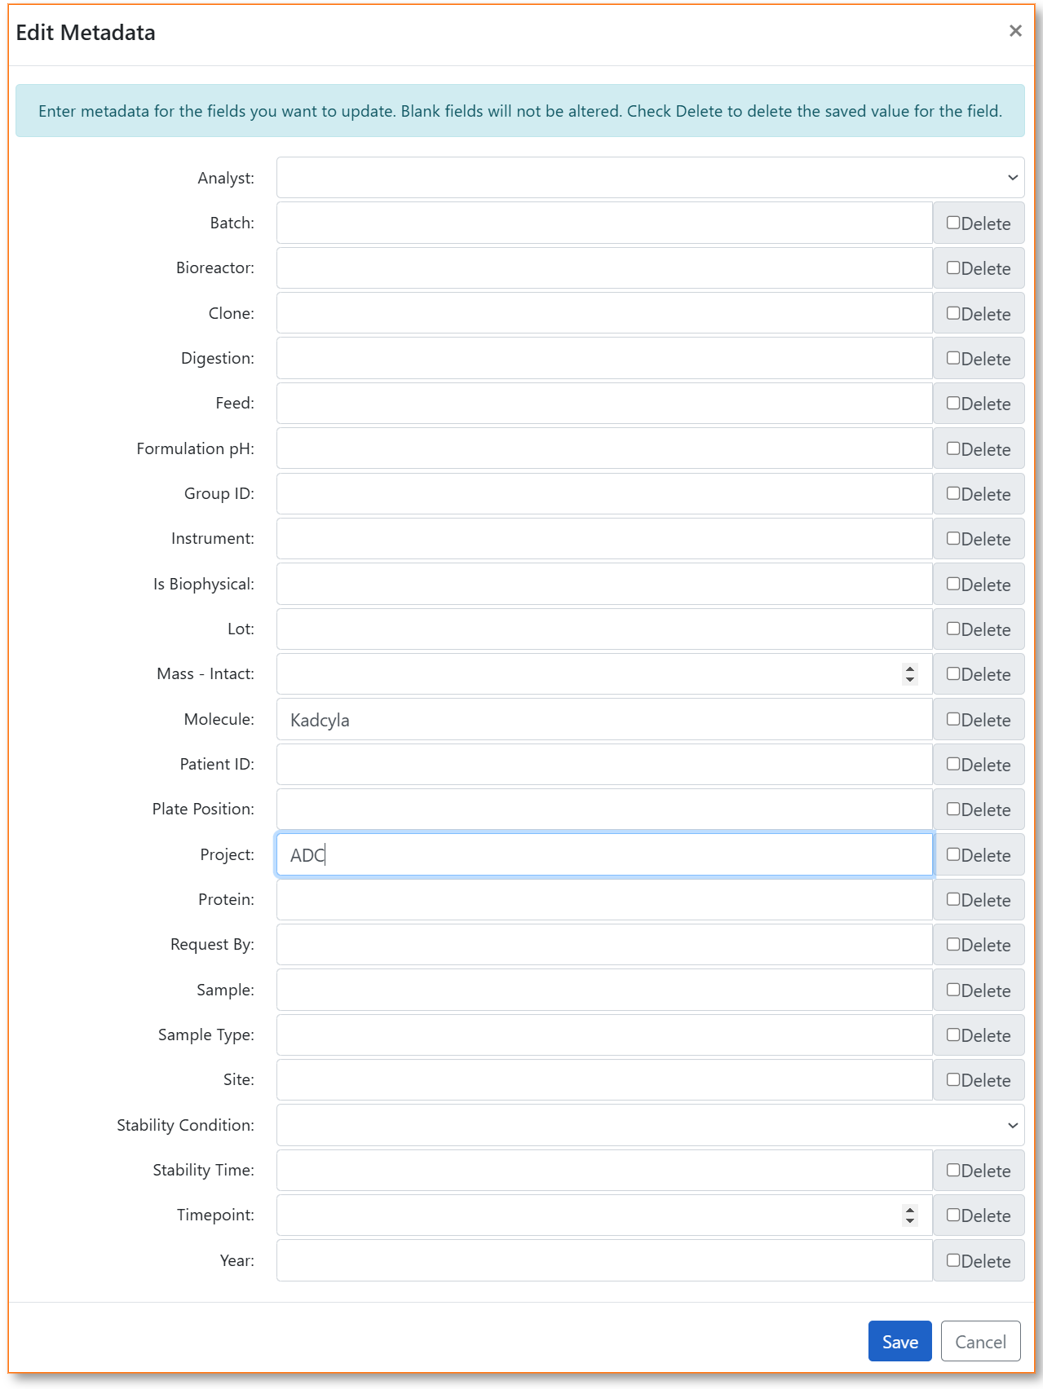
2. Add/Edit Metadata Tags (if needed):
- Use the Browse window to select projects.
- Choose "Edit Metadata" to update tags as required.
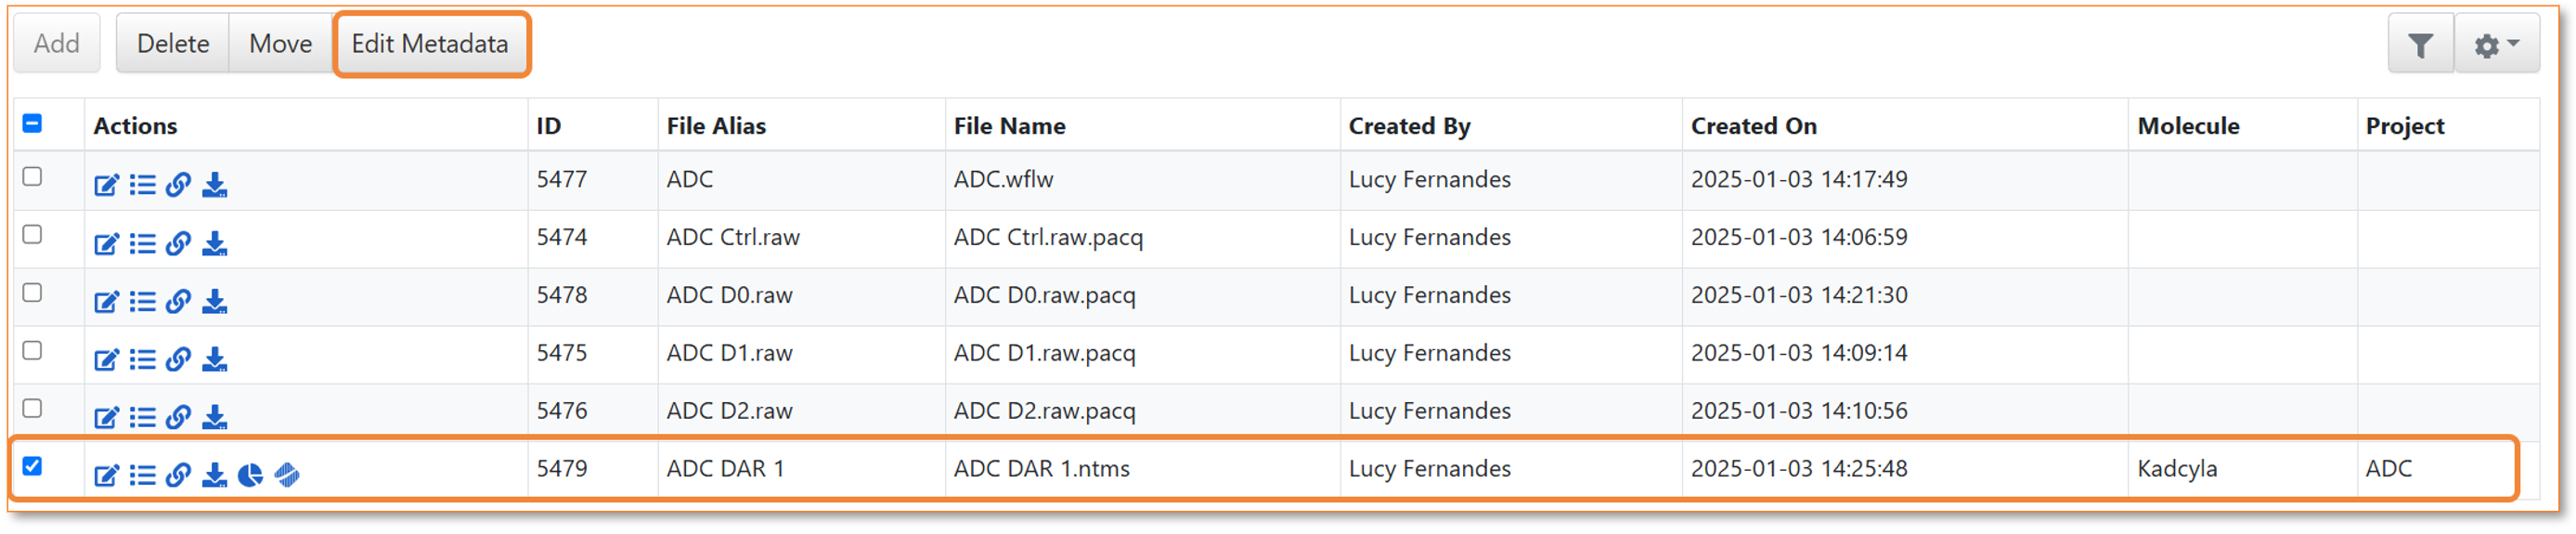
- Metadata can then be added or edited accordingly:
Once the global filters have been configured to pull in the tagged projects, the dashboard will be updated:
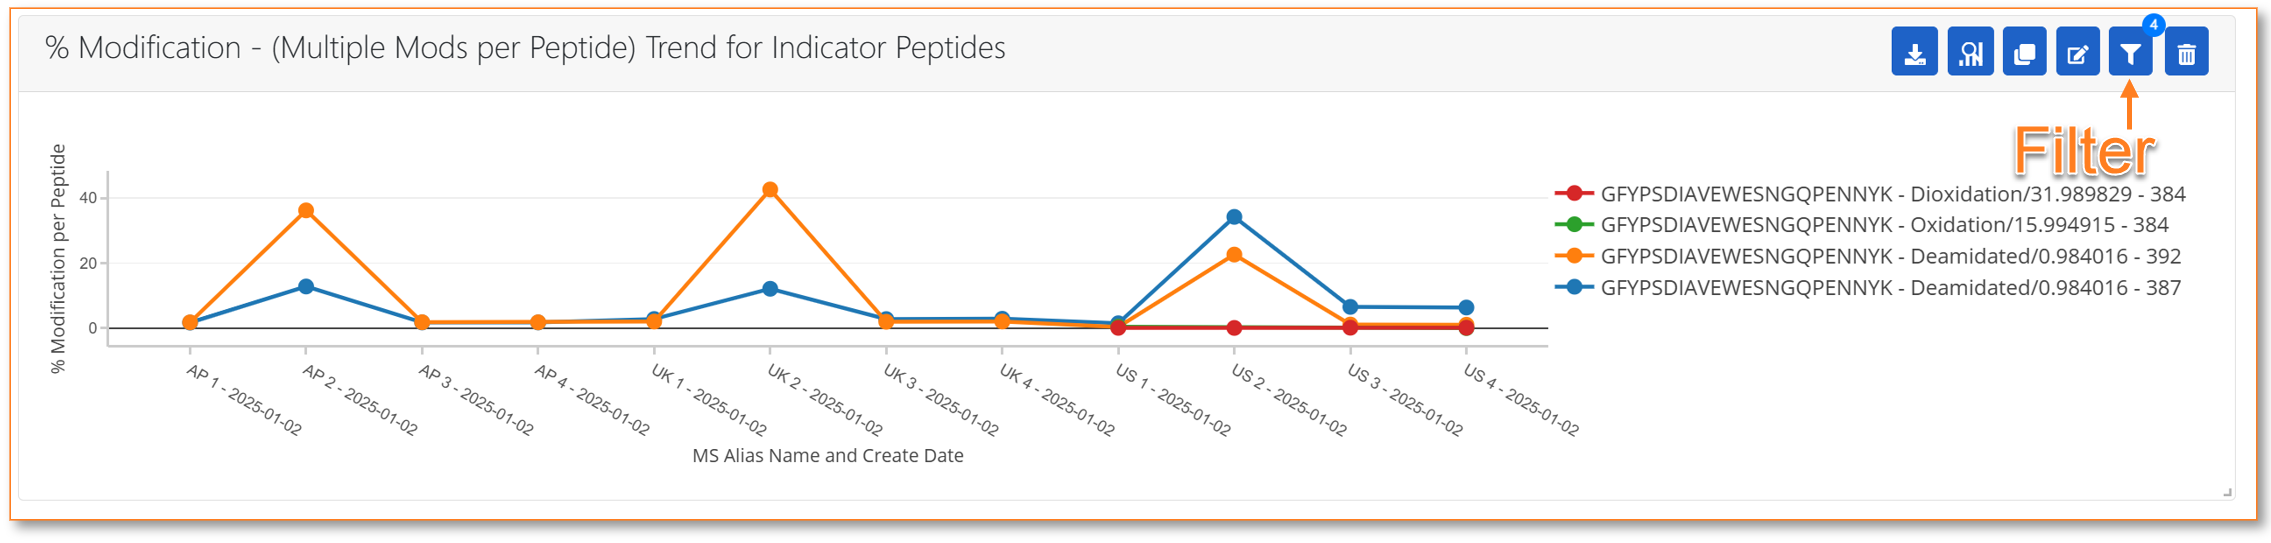
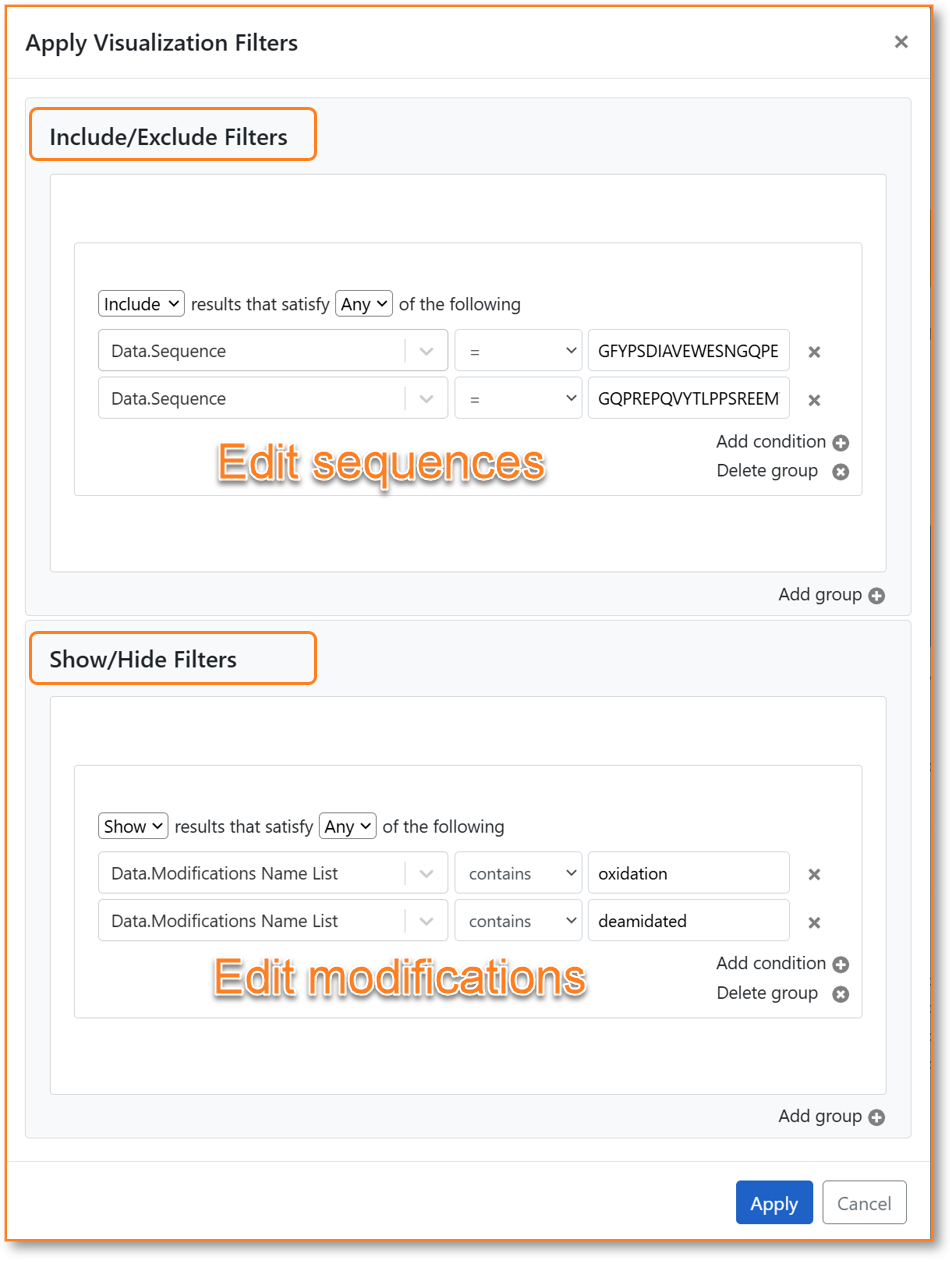
3. Update Visualization Filters:
Some templates include visualization-level filters to track components across a series. For example, the % Modification Line Chart in the PTM Dashboard tracks specific peptides. The peptides that are tracked can be edited under the visualization filter settings.
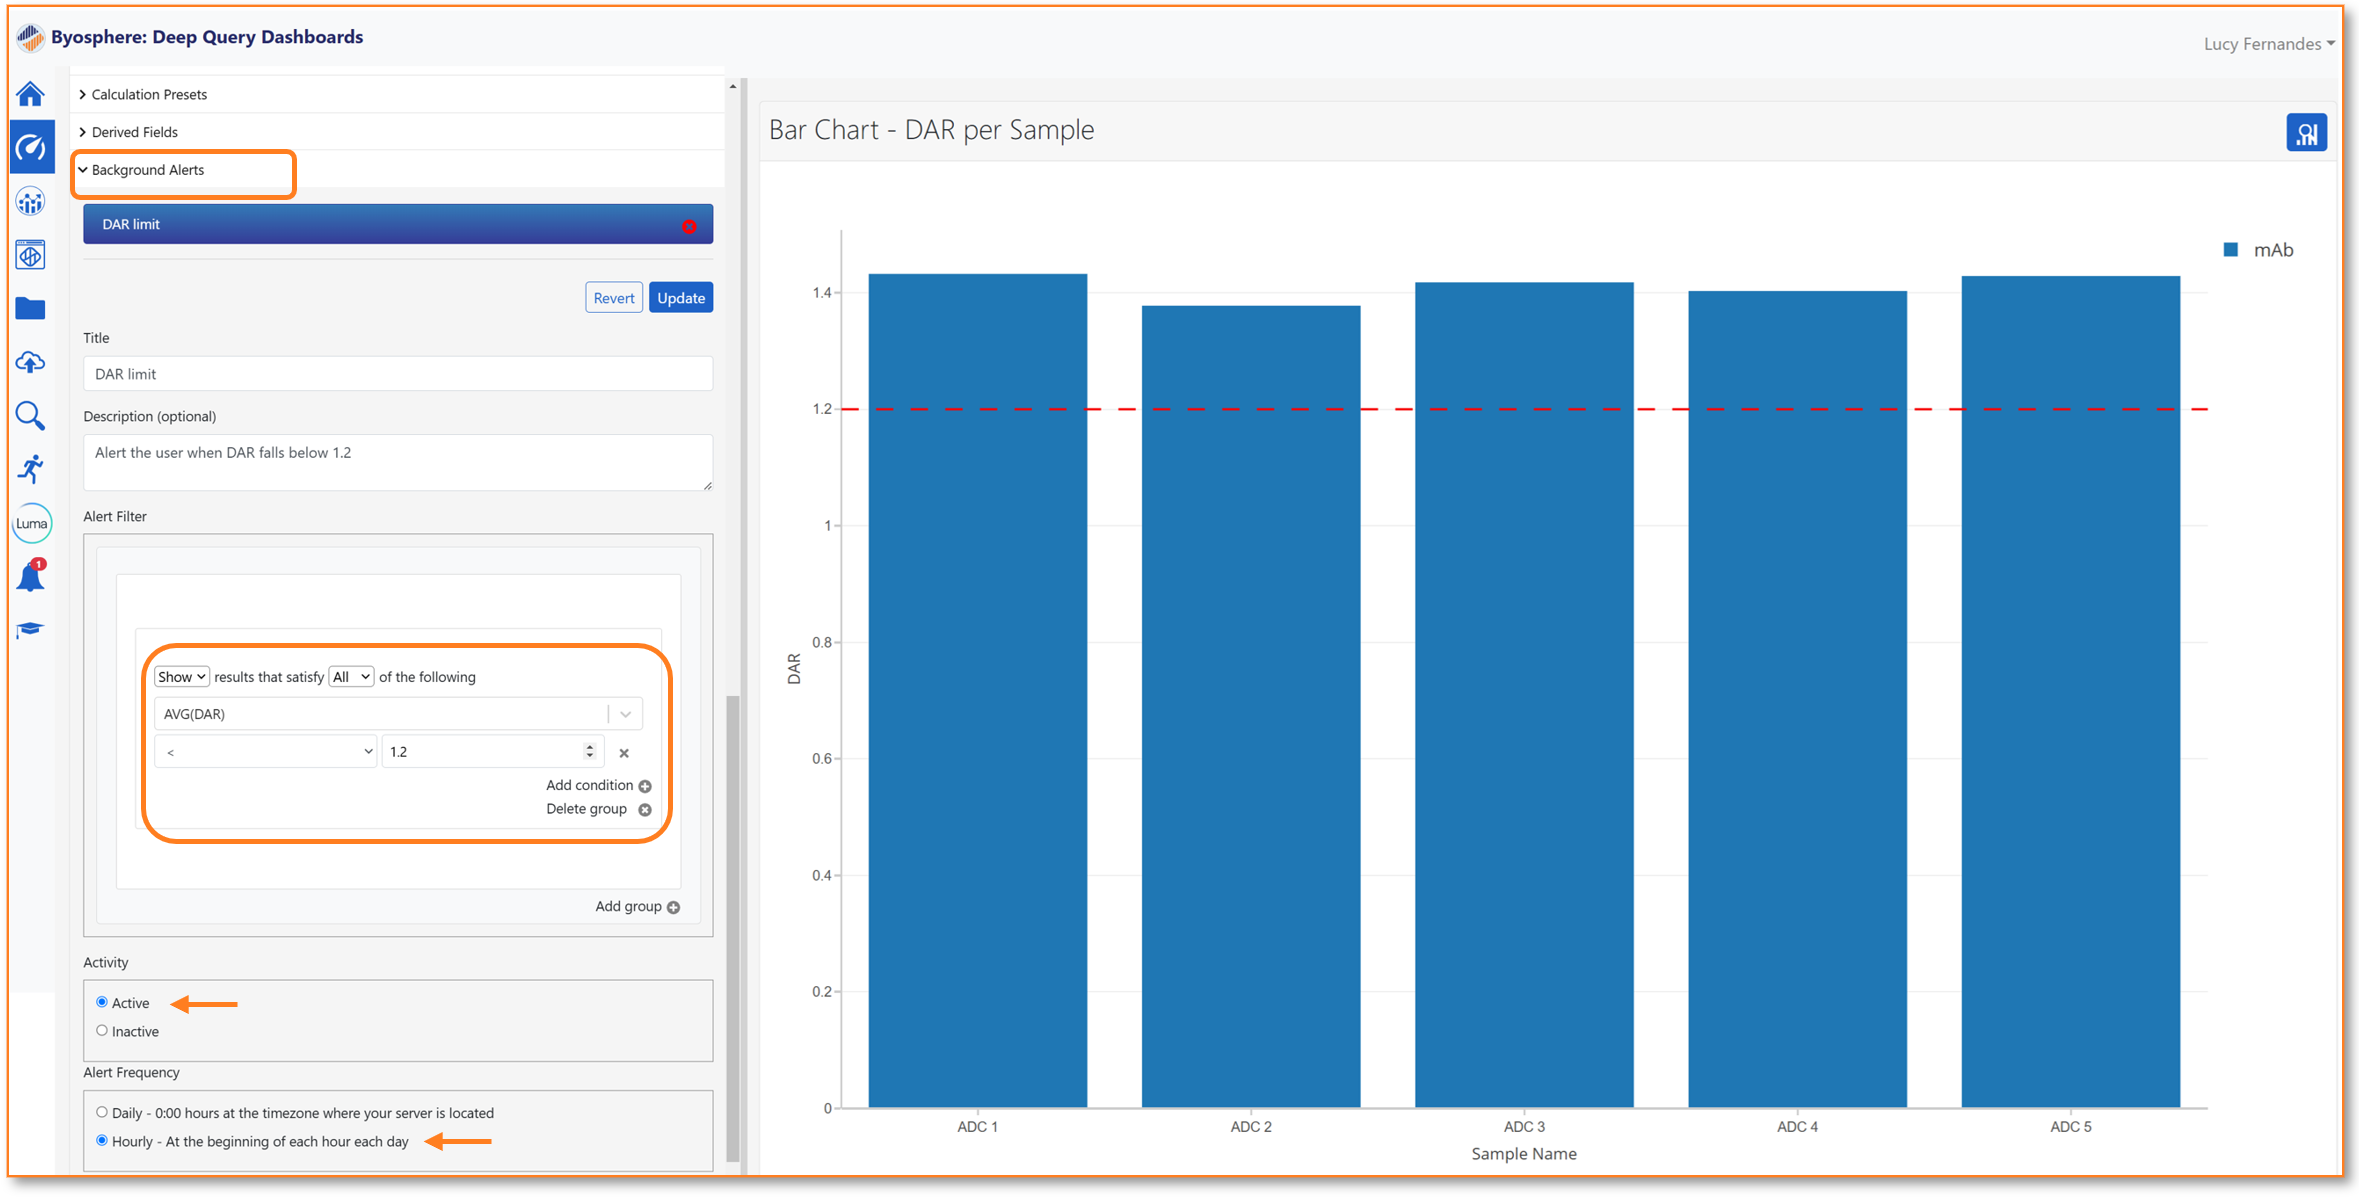
Setting Background Alerts
Dashboards are instantly updated when new data is processed and added to the Byosphere database. The background alert function enables notifications to be sent to the user when specific parameters fall outside of a defined range.
For example, the ADC Dashboard can be configured to warn users if the DAR value drops below a desired level.
Steps to Set Up Alerts:
- Select the Edit option on the visualization where you want to configure the alert.
- Go to the Data Settings tab and define the necessary parameters.
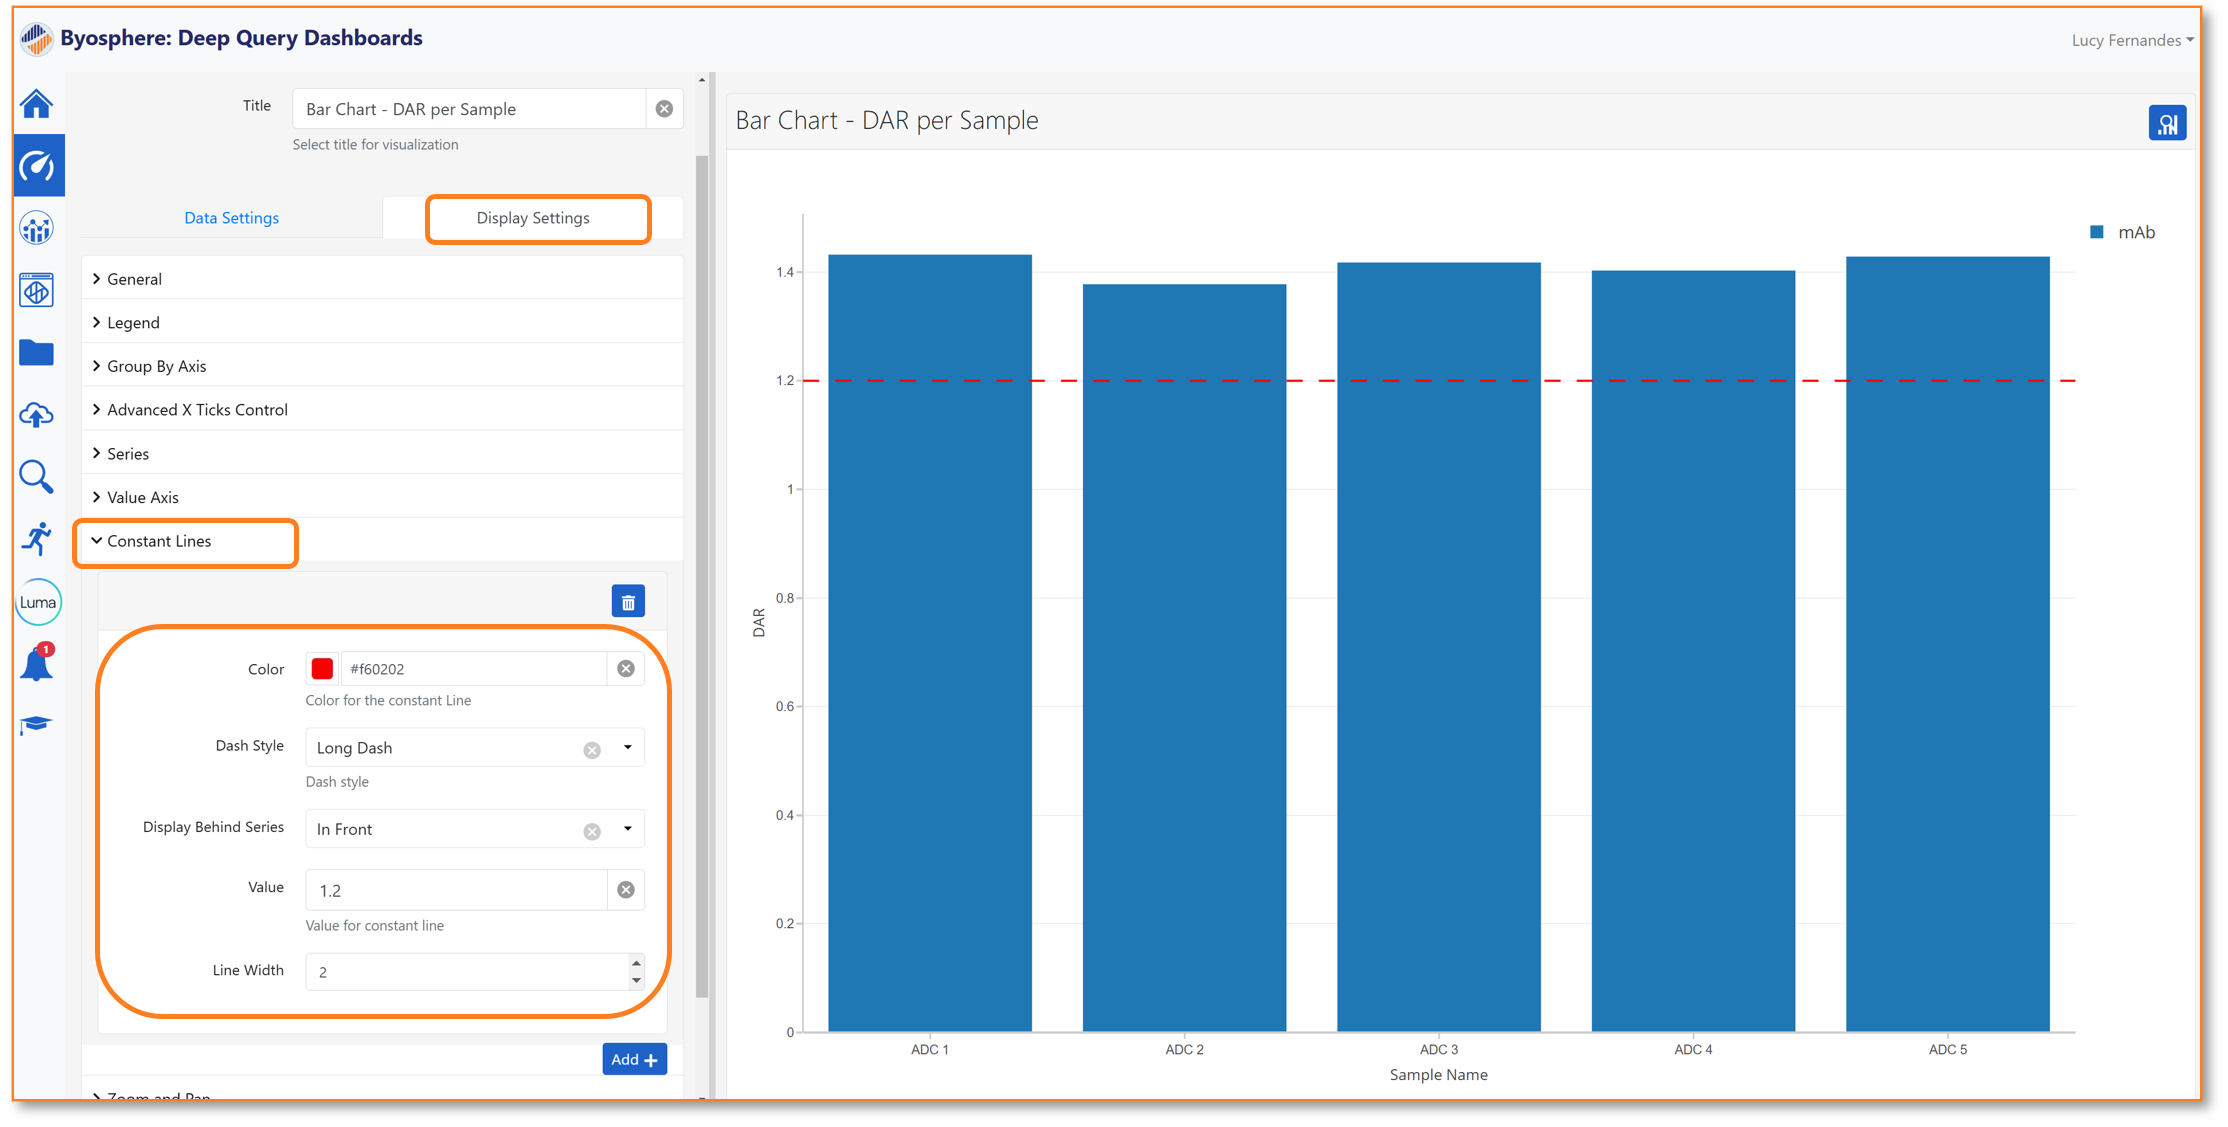
A constant line, is a way of adding a visual line over the plot to indicate what threshold has been set. This can be set-up in the Display Settings tab:
Tips and Tricks
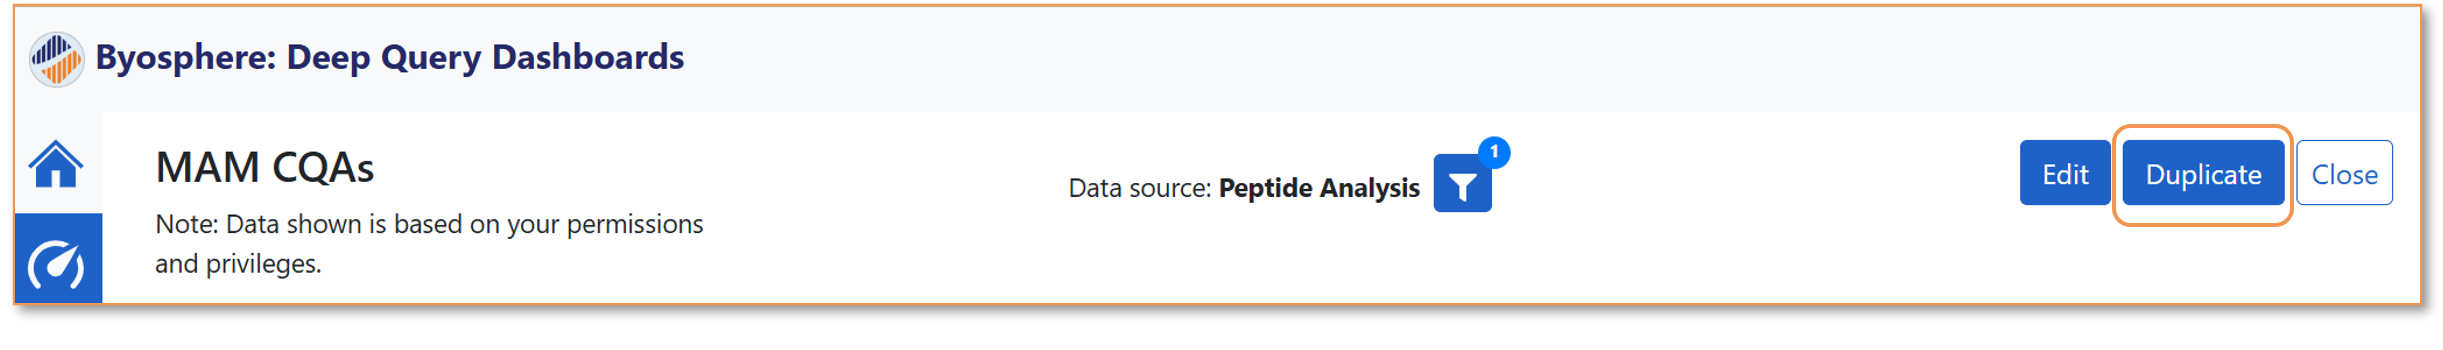
The Duplicate function can be used to create a new dashboard directly from an existing one. Once Duplicate is selected the new dashboard is saved and can be edited as required.
It's possible to create a dashboard entirely from scratch, using the New dashboard option.
Full details on creating and editing dashboards can be found in the user guide. Extra support on this (or any topic) can be provided by the CS team by emailing support@proteinmetrics.com