The purity and impurity analysis of synthetic oligonucleotides can be performed in Byos as outlined in this article. Here we provide a detailed step-by-step description that guides through the three key steps: Project Creation, Data Inspection, and Reporting of Results.
Project Creation
A custom workflow was developed for this application and is available on request by contacting support@proteinmerics.com
A general overview of the whole workflow is displayed in Figure 1.
Figure 1. Overview of the workflow.
To start, open Byos, navigate to File → Launch Workflow, and select the desired workflow. Once the workflow is launched, drag and drop your sample files into the samples table, or click the "Add sample(s)..." button to select files via the file explorer. Typically, three files are needed for this analysis (see Materials and Methods). The files can then be categorized under the "Condition" column as "Standard," "Widescan," or "Harsh". If spectroscopic traces are not embedded in the MS raw files, they can be separately defined in the "Trace Files" column (see Figure 3).
Figure 3. Adding samples and trace files.
Species Definition and Mass Matching
In the next tab, species are defined either by oligonucleotide sequence or average mass. For simplicity in this example, each species is defined by its average mass, although the Oligo manual provides a detailed description of how to define sequences (see Figure 4).
Figure 4. Adding sequences or masses.
The Mass Matching tab contains two subsections:
- Tolerances: This section defines the error tolerance for matching a deconvoluted peak to a candidate species.
- Delta Masses: This section allows the definition of variable modifications.
Final Configuration and Project Generation
The final step is configuring the processing nodes. This workflow includes three processing steps, each of which generates an output file, resulting in three distinct files:
- One intact oligo project for the main species
- One intact oligo project for early-eluting peaks
- One Byologic project file for quantifying the identified species
After clicking "Create Project...", a window will appear prompting you to define a target folder for saving the project files. Assign a project name and click "OK" to complete the setup (see Figure 5).
Figure 5. Configuration of single processing nodes.
Data Inspection
The data inspection process for each oligo intact project file consists of two main steps:
Step 1: Reviewing Automated Peak Picking
The first step involves reviewing the automated peak picking results and correcting any inaccuracies. The next step is to deconvolute the summed spectra beneath each peak.
Step 2: Deconvolution and Peak Assignment
The deconvolution settings differ between the two types of oligo intact files. For the main peak, a narrow m/z range is used, and only one charge state is expected (see Materials and Methods for details). The deconvolution settings for the main peak are shown in Figure 6.
Figure 6. Deconvolution settings for the main peak.
For the early-eluting peaks, the summed mass spectra are processed with wider mass, m/z, and charge ranges. Peak assignment to the candidate species, as defined during project creation, is then reviewed. This step is more complex for the early-eluting peaks due to the broader mass and charge range (see Figure 7).
Figure 7. Deconvolution settings for the early eluting peaks.
Mass XIC Plot for Peak Validation
The Mass XIC (Extracted Ion Chromatogram) feature, in the Intact Oligo module, is a valuable tool for distinguishing real from false positive peak assignments. This feature aggregates XIC's from multiple charge states for each species. Figure 8 illustrates two different peak assignments. The orange trace shows a peak with high intensity, where the apex time aligns with the chromatographic peak. In contrast, the blue trace only shows noise peaks, indicating that this assignment is likely a false positive. False positives can be filtered out by unchecking the box in the “Assigned” column.
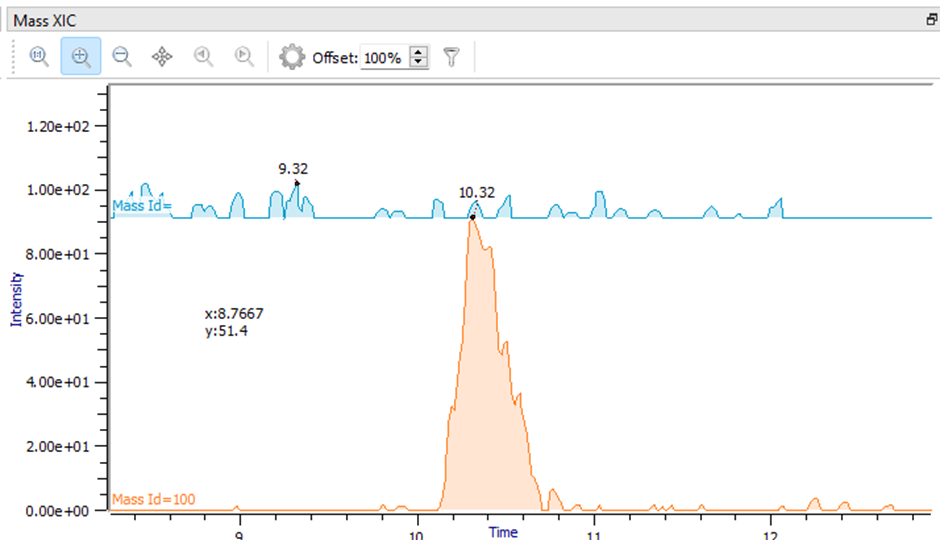 Figure 8. Mass XIC plot for peak validation.
Exporting CSV Files
After reviewing the peak assignments, the results for each oligo intact project must be exported as a CSV file. This CSV file, which contains a list of all identified species, can then be imported into the Byologic project file (created alongside the oligo intact files). Additionally, a custom report is available in the report section of each oligo intact file, which can be exported directly into a CSV format with the appropriate column headers (see Figure 9).
Two separate reports are generated: one for the main peak and another for the early eluting peaks. The selected charge state for the main peak is -4, while for the early eluting peaks, the charge state ranges from 1 to 4, depending on the mass. The created CSV files can also be extended to include species that should be monitored on a routine basis.
Figure 9. Exporting in-silico CSV files.
Quantitation in Byologic
The exported CSV files are imported into the Byologic project file, which was created alongside the intact oligo files. To do open the Byologic file, navigate to Edit → In-silico Peptides → Add In-Silico Peptides From CSV File. This step must be repeated for each CSV file that was exported. After importing, the empty "Peptides" table will be populated with the identified species. Each row should then be reviewed and validated (see Figure 10).
Figure 10. Validating species in Byologic.
Reviewing Impurities and Stacked Plots
Starting with the main peak impurities, XIC traces from different files can be stacked by selecting Window → Enabled Stacked Plots. This view allows for the comparison of profiles acquired under different MS conditions. Figure 11 shows an example where one species remains intact, suggesting it is not an adduct, while another species shows reduced signal intensity under harsh conditions, indicating it is likely an adduct.
Figure 11. Differentiating adduct from chemical impurities.
Purity Calculation
Once data inspection is complete, further processing occurs in the report section. The purity of the sample is calculated using the UVxMS value. Because multiple species can co-elute to form a single chromatographic peak, UV area alone is insufficient for accurate purity calculation. Instead, by quantifying the fractions of each species based on XIC intensity, a more precise purity calculation is made. The report performs this calculation and outputs the results in a table (see Figure 12).
Figure 12. UVxMS report.
Acknowledgments
With thanks to Edward Wilkinson and David Benstead of AstraZeneca for contributing data and discussion. The contributions do not constitute an endorsement of the software by AstraZeneca. (Chemical Development, Pharmaceutical Technology & Development, AstraZeneca, Macclesfield, UK)